총 308페이지
271페이지 본문시작
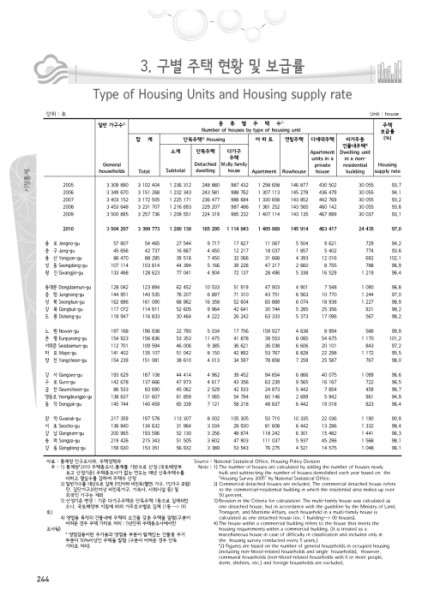
3. 구별 주택 현황 및 보급률
Type of Housing Units and Housing supply rate
단위 : 호
Unit : house
종 류 별 주 택 수
1)
일반 가구수
주택
2)
Number of houses by type of housing unit
보급률
합 계
단독주택
Housing
아 파 트
연립주택
다세대주택
비거주용
3)
건물내주택
4)
소계
단독주택
다가구
Apartment
Dwelling unit
주택
units in a
in a non-
Detached
Multy family
General
private
residential
Housing
Subtotal
dwelling
house
households
Total
Apartment
Rowhouse
house
building
supply rate
2005
3 309 890
3 102 404
1 236 312
248 880
987 432
1 258 658
146 877
430 502
30 055 93.7
시정통계
2006
3 349 670
3 151 268
1 232 343
243 581
988 762
1 307 113
145 278
436 479
30 055 94.1
2007
3 403 152
3 172 505
1 225 171
236 477
988 694
1 330 658
143 852
442 769
30 055 93.2
2008
3 453 648
3 231 707
1 216 693
229 207
987 486
1 381 252
143 565
460 142
30 055 93.6
2009
3 500 895
3 257 736
1 209 551
224 319
985 232
1 407 114
143 135
467 899
30 037 93.1
2010
3 504 297
3 399 773
1 280 138
165 295 1 114 843
1 485 869
145 914
463 417
24 435 97.0
종 로 Jongno-gu
57 807
54 465
27 544
9 717
17 827
11 067
5 504
9 621
729 94.2
중 구 Jung-gu
45 656
42 737
16 667
4 450
12 217
18 037
1 857
5 402
774 93.6
용 산 Yongsan-gu
86 470
88 285
39 516
7 450
32 066
31 668
4 393
12 016
692 102.1
성 동 Seongdong-gu
107 114
103 814
44 394
5 166
39 228
47 217
2 660
8 755
788 96.9
광 진 Gwangjin-gu
133 468
128 623
77 041
4 904
72 137
28 496
5 338
16 529
1 219 96.4
동대문 Dongdaemun-gu
128 042
123 894
62 452
10 533
51 919
47 903
4 901
7 548
1 090 96.8
중 랑 Jungnang-gu
144 951
140 535
78 207
6 897
71 310
43 751
6 563
10 770
1 244 97.0
성 북 Seongbuk-gu
162 896
161 090
68 962
16 358
52 604
65 889
6 074
18 938
1 227 98.9
강 북 Gangbuk-gu
117 072
114 911
52 605
9 964
42 641
30 744
5 285
25 356
921 98.2
도 봉 Dobong-gu
118 947
116 833
30 464
4 222
26 242
63 333
5 373
17 096
567 98.2
노 원 Nowon-gu
197 168
196 938
22 790
5 034
17 756
159 927
4 638
8 994
589 99.9
은 평 Eunpyeong-gu
154 923
156 836
53 353
11 475
41 878
39 553
8 085
54 675
1 170 101.2
서대문 Seodaemun-gu
112 701
109 594
46 006
9 385
36 621
36 038
6 606
20 101
843 97.2
마 포 Mapo-gu
141 402
135 107
51 042
8 150
42 892
53 767
6 828
22 298
1 172 95.5
양 천 Yangcheon-gu
154 239
151 081
38 610
4 013
34 597
78 858
7 259
25 587
767 98.0
강 서 Gangseo-gu
193 629
187 108
44 414
4 962
39 452
94 654
6 866
40 075
1 099 96.6
구 로 Guro-gu
142 678
137 666
47 973
4 617
43 356
63 239
9 565
16 167
722 96.5
금 천 Geumcheon-gu
86 533
83 690
45 062
2 529
42 533
24 873
5 442
7 854
459 96.7
영등포 Yeongdeungpo-gu
138 637
131 607
61 859
7 065
54 794
60 146
2 699
5 942
961 94.9
동 작 Dongjak-gu
145 744
140 459
65 339
7 121
58 218
48 837
6 442
19 018
823 96.4
관 악 Gwanak-gu
217 359
197 578
113 307
8 002
105 305
50 710
10 335
22 036
1 190 90.9
서 초 Seocho-gu
136 840
134 632
31 964
3 034
28 930
81 608
6 442
13 286
1 332 98.4
강 남 Gangnam-gu
200 965
193 596
52 130
3 256
48 874
118 242
6 301
15 482
1 441 96.3
송 파 Songpa-gu
219 426
215 343
51 505
3 602
47 903
111 037
5 937
45 296
1 568 98.1
강 동 Gangdong-gu
159 630
153 351
56 932
3 389
53 543
76 275
4 521
14 575
1 048 96.1
자료 : 통계청 인구조사과, 주택정책과
Source : National Statistical Office, Housing Policy Division
주 : 1) 통계청「2010 주택총조사」통계를 기반으로 산정 (국토해양부
Note : 1) The number of houses are calculated by adding the number of houses newly
보고 산정기준) 주택총조사가 없는 연도는 매년 신축주택수를
built and subtracting the number of houses demolished each year based on the
더하고 멸실수를 감하여 주택수 산정
"Housing Survey 2005" by National Statistical Office.
2) 일반가구를 대상으로 집계 (5인이하 비친족(혈연) 가구, 1인가구 포함)
2) Commercial detached houses are included. The commercial detached house refers
단, 집단가구(6인이상 비친족가구, 기숙사, 사회시설 등) 및
to the commercial-residential building in which the residential area makes up over
외국인 가구는 제외
50 percent.
3) 산정기준 변경 : 기존 다가구주택은 단독주택 1동으로 집계되었
3) Revision in the Criteria for calculation: The multi-family house was calculated as
으나, 국토해양부 지침에 따라 거주호수별로 집계 (1동 --> 00
one detached house, but in accordance with the guideline by the Ministry of Land,
Transport, and Maritime Affairs, each household in a multi-family house is
4) 영업용 목적의 건물내에 주택의 요건을 갖춘 주택을 말함(구분이
calculated as one detached house (ex. 1 building--> 00 houses).
어려운 경우 주택 기타로 처리 : 5년단위 주택총조사에서만
4) The house within a commercial building refers to the house that meets the
조사됨)
housing requirements within a commercial building. (It is treated as a
* 영업겸용이란 주거용과 영업용 부분이 함께있는 건물중 주거
miscellaneous house in case of difficulty in classfication and included only in
부분이 50%이상인 주택을 말함 (구분이 어려운 경우 단독
the housing survey conducted every 5 years.)
기타로 처리)
*2) Figures are based on the number of general households in occupied housing
(including non-blood-related households and single households). However,
communal households (non-blood-related households with 6 or more people,
dorm, shelters, etc.) and foreign households are excluded.
244
271페이지 본문끝
메뉴
현재 포커스의 아래내용들은 동일한 컨텐츠를 가지고 페이지넘김 효과및 시각적 효과를 제공하는 페이지이므로 스크린리더 사용자는 여기까지만 낭독하시고 위의 페이지이동 링크를 사용하여 다음페이지로 이동하시기 바랍니다.