총 308페이지
272페이지 본문시작
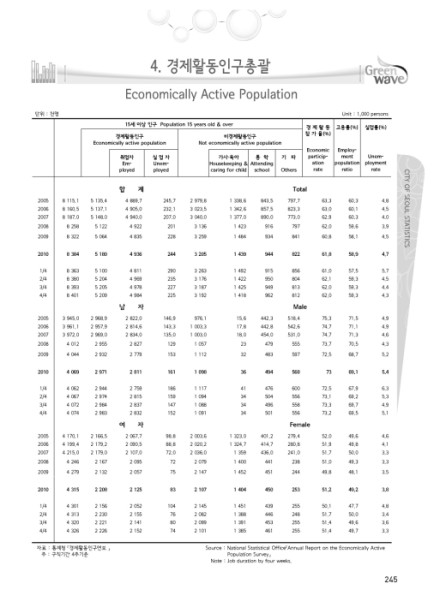
4. 경제활동인구총괄
Economically Active Population
단위 : 천명
Unit : 1,000 persons
15세 이상 인구 Population 15 years old & over
경 제 활 동
고용률(%)
실업률(%)
참 가 율(%)
경제활동인구
비경제활동인구
Economically active population
Not economically active population
Economic
Employ-
취업자
실 업 자
가사·육아
통 학
기 타
particip-
ment
Unem-
Unem-
Housekeeping &
Attending
ation
population
ployment
CITY OF SEOUL STATISTICS
ployed
ployed
caring for child
school
Others
rate
ratio
rate
합 계
Total
2005
8 115.1
5 135.4
4 889.7
245.7
2 979.8
1 338.6
843.5
797.7
63.3
60.3
4.8
2006
8 160.5
5 137.1
4 905.0
232.1
3 023.5
1 342.6
857.5
823.3
63.0
60.1
4.5
2007
8 187.0
5 148.0
4 940.0
207.0
3 040.0
1 377.0
890.0
773.0
62.9
60.3
4.0
2008
8 258
5 122
4 922
201
3 136
1 423
916
797
62.0
59.6
3.9
2009
8 322
5 064
4 835
228
3 259
1 484
934
841
60.8
58.1
4.5
2010
8 384
5 180
4 936
244
3 205
1 439
944
822
61.8
58.9
4.7
1/4
8 363
5 100
4 811
290
3 263
1 492
915
856
61.0
57.5
5.7
2/4
8 380
5 204
4 969
235
3 176
1 422
950
804
62.1
59.3
4.5
3/4
8 393
5 205
4 978
227
3 187
1 425
949
813
62.0
59.3
4.4
4/4
8 401
5 209
4 984
225
3 192
1 418
962
812
62.0
59.3
4.3
남 자
Male
2005
3 945.0
2 968.9
2 822.0
146.9
976.1
15.6
442.3
518.4
75.3
71.5
4.9
2006
3 961.1
2 957.9
2 814.6
143.3
1 003.3
17.8
442.8
542.6
74.7
71.1
4.9
2007
3 972.0
2 969.0
2 834.0
135.0
1 003.0
18.0
454.0
531.0
74.7
71.3
4.6
2008
4 012
2 955
2 827
129
1 057
23
479
555
73.7
70.5
4.3
2009
4 044
2 932
2 779
153
1 112
32
483
597
72.5
68.7
5.2
2010
4 069
2 971
2 811
161
1 098
36
494
568
73
69.1
5.4
1/4
4 062
2 944
2 759
186
1 117
41
476
600
72.5
67.9
6.3
2/4
4 067
2 974
2 815
159
1 094
34
504
556
73.1
69.2
5.3
3/4
4 072
2 984
2 837
147
1 088
34
496
558
73.3
69.7
4.9
4/4
4 074
2 983
2 832
152
1 091
34
501
556
73.2
69.5
5.1
여 자
Female
2005
4 170.1
2 166.5
2 067.7
98.8
2 003.6
1 323.0
401.2
279.4
52.0
49.6
4.6
2006
4 199.4
2 179.2
2 090.5
88.8
2 020.2
1 324.7
414.7
280.8
51.9
49.8
4.1
2007
4 215.0
2 179.0
2 107.0
72.0
2 036.0
1 359
436.0
241.0
51.7
50.0
3.3
2008
4 246
2 167
2 095
72
2 079
1 400
441
238
51.0
49.3
3.3
2009
4 279
2 132
2 057
75
2 147
1 452
451
244
49.8
48.1
3.5
2010
4 315
2 208
2 125
83
2 107
1 404
450
253
51.2
49.2
3.8
1/4
4 301
2 156
2 052
104
2 145
1 451
439
255
50.1
47.7
4.8
2/4
4 313
2 230
2 155
76
2 082
1 388
446
248
51.7
50.0
3.4
3/4
4 320
2 221
2 141
80
2 099
1 391
453
255
51.4
49.6
3.6
4/4
4 326
2 226
2 152
74
2 101
1 385
461
255
51.4
49.7
3.3
자료 : 통계청 「경제활동인구연보 」
Source : National Statistical Office「Annual Report on the Economically Active
주 : 구직기간 4주기준
Population Survey」
Note : Job duration by four weeks.
245
272페이지 본문끝
메뉴
현재 포커스의 아래내용들은 동일한 컨텐츠를 가지고 페이지넘김 효과및 시각적 효과를 제공하는 페이지이므로 스크린리더 사용자는 여기까지만 낭독하시고 위의 페이지이동 링크를 사용하여 다음페이지로 이동하시기 바랍니다.